Blog Sheet Week 11
Part A: Strain Gauges
Strain gauges are used to measure the strain or stress levels on the materials. Alternatively, pressure on the strain gauge causes a generated voltage and it can be used as an energy harvester. You will be given either the flapping or tapping type gauge. When you test the circle buzzer type gauge, you will lay it flat on the table and tap on it. If it is the long rectangle one, you will flap the piece to generate voltage.
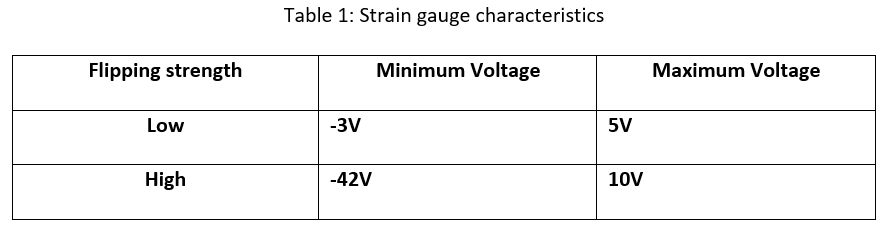
1. Connect the oscilloscope probes to the strain gauge. Record the peak voltage values (positive and negative) by flipping/tapping the gauge with low and high pressure. Make sure to set the oscilloscope horizontal and vertical scales appropriately so you can read the values. DO NOT USE the measure tool of the oscilloscope. Adjust your oscilloscope so you can read the values from the screen. Fill out table 1 and provide photos of the oscilloscope.
 |
| Low flipping strength |
 |
| High flipping strength |
2. Press the "Single" button below the Autoscale button on the oscilloscope. This mode will allow you to capture a single change at the output. Adjust your time and amplitude scales so you have the best resolution for your signal when you flip/tap your strain gauge. Provide a photo of the oscilloscope graph.
 |
| Our oscilloscope in "single" mode |
Part B: Half-Wave Rectifiers
1. Construct the following half-wave rectifier. Measure the input and output using the oscilloscope and provide snapshots of the outputs.
 |
| Fig. 1 |
 |
| Half-wave rectifier input |
 |
| Half-wave rectifier output |
2. Calculate the effective voltage of the input and output and compare the values with the measured ones by completing the following table:
 |
| Table 2: calculated vs measured half-wave values |
3. Construct the following circuit and record the output voltage using both DMM and the oscilloscope.
 |
| Fig. 2 |
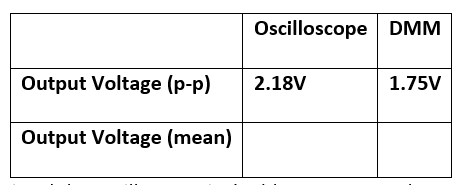 |
| Our table of the output voltage |
Since we have a partial DC signal the oscilloscope isn't able to measure the mean value of the output voltage.
4. Replace the 1 microfarad capacitor with a 100 microfarad capacitor and repeat the previous step. What has changed?
 |
| Our table of the output voltage with a higher capacitance |
The larger capacitor is smoothing out the signal more than the previous capacitor. Using the larger smoothing capacitor we are only seeing the DC signal. We had an issue with the signal being close to the noise floor when we were using the AC coupling and when we changed it to the DC coupling we were able to distinguish the DC voltage ripple from the noise floor.
Part C: Energy Harvesters
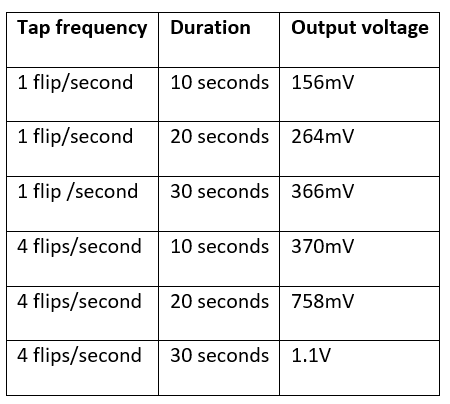
1. Construct the half-wave rectifier circuit without the resistor but with the 1 microfarad capacitor. Instead of the function generator, use the strain gauge. Discharge the capacitor every time you start a new measurement. Flip/tap your strain gauge and observe the output voltage. Fill out the table below: (We're using a 47 microfarad capacitor)
 |
| Our table of measurements using the energy harvester |
2. Briefly explain your results.
As you can see from the above table, the longer you charge the capacitor the higher the output voltage. It also increases faster the more times you tap the strain gauge per second.
3. If we do not use the diode in the circuit (i.e. using only the strain gauge to charge the capacitor), what would you observe at the output? Why?
When we remove the diode we observe only noise on the oscilloscope. We are observing the capacitor charge and discharge continuously, the diode stops the charge from the capacitor going through it in the opposite direction.
Looks good! Those waves really came out square in part A!
ReplyDeleteNick
Thanks!
DeleteFor part B 3 and 4, you should be able to measure the peak to peak value with the oscilloscope. The rest of your blog looks accurate.
ReplyDelete-Matt
I'm confused, I thought we had the peak to peak values listed for B 3 and 4.
DeleteHow did you measure the peak to peak value with the DMM? It was my understanding that the DMM could not accomplish that.
ReplyDelete-Ben
It's my understanding that the DMM measures peak to peak on the AC setting. I could be wrong...
DeleteHey guys, looking at your part one values something feels a bit off. Why were you getting such a high minimum voltage? We were getting the same oscilloscope graph but flipped on the x-axis. Also for part b 3 and 4 you should be able to get the mean values if you set the oscilloscope and DMM to AC mode.
ReplyDeleteWe're not sure why our minimum values were so high, we just recorded what was on the oscilloscope.
DeleteYour tables and pictures are all so neatly formatted. I have to agree with Ben though - I was told the DMM is unable to measure output peak to peak and mean.
ReplyDeleteThanks! We were so tired of trying to copy and paste tables from excel so we just started using the snipping tool to get all the original tables from the blog sheet onto the blog.
Delete- you must have forgotten to switch to 10x probe setting. Those values are almost not possible.
ReplyDelete- DMM measures effective (rms) value.